If you’re a parent, few things grab your attention faster than numbers on a growth chart.
One visit to the pediatrician and suddenly you’re hearing phrases like “25th percentile” or “75th percentile,” leaving you wondering if your baby’s weight is truly normal.
That’s exactly where a baby weight percentile calculator can help—by turning confusing data into clear, reassuring insight.
This tool allows you to quickly calculate your baby’s weight percentile based on age and gender, using trusted growth standards.
Instead of guessing or comparing your child to others, you’ll see where your baby falls on the growth curve and what that placement actually means.
Most importantly, percentiles are not grades or judgments they’re simply a way to track growth patterns over time.
Whether your baby is newborn, an infant, or a growing toddler, understanding weight percentiles can give you peace of mind and help you have more informed conversations with your pediatrician.
What Is a Baby Weight Percentile?
A baby weight percentile is a simple way doctors and parents compare a baby’s weight to other babies of the same age and gender. It shows how your baby’s weight ranks on a standardized growth chart, not whether your baby is “good” or “bad” at growing.
For example, if your baby is in the 50th percentile, it means that about half of babies the same age and gender weigh less, and half weigh more. If your baby is in the 25th percentile, it means 25% of babies weigh less and 75% weigh more. This doesn’t automatically signal a problem—many perfectly healthy babies naturally fall on the lower or higher ends of the chart.
Pediatricians use weight percentiles because babies grow at different rates. Genetics, feeding patterns, birth weight, and overall health all play a role. Percentiles help track growth trends over time, which is far more important than a single number from one appointment.
Baby weight percentiles are calculated using internationally recognized growth standards, most commonly from the World Health Organization (WHO) and the Centers for Disease Control and Prevention (CDC). These charts are based on large populations of healthy children and are designed to reflect normal growth patterns.
It’s also important to remember that percentiles change. A baby may move up or down as they experience growth spurts, feeding changes, or developmental milestones. What matters most is steady, consistent growth—not hitting a specific percentile. Understanding this helps parents focus on overall health rather than unnecessary worry over numbers.
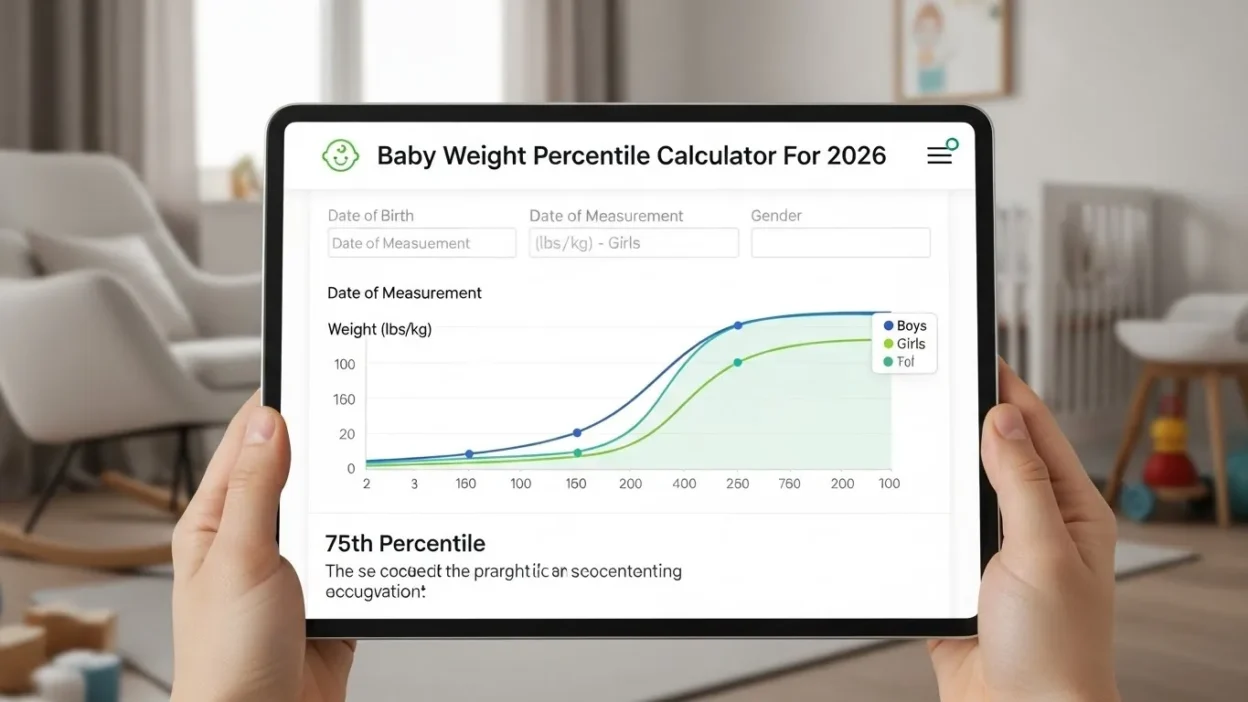
Baby Weight Percentile Calculator
A baby weight percentile calculator is a quick and easy tool that helps you determine where your baby’s weight falls on a growth chart. Instead of trying to interpret complex tables or medical charts on your own, the calculator does the work for you and provides a clear percentile result in seconds.
To use the calculator, you typically need to enter three basic details: your baby’s age, gender, and current weight. Age is usually measured in weeks or months, while weight can be entered in kilograms or pounds. Once this information is submitted, the calculator compares your baby’s measurements with established growth standards to determine the percentile.
Most reliable calculators use data from the WHO for babies under two years old and the CDC for older infants and toddlers. These standards are widely used by pediatricians and are designed to represent healthy growth patterns across large populations. By relying on these trusted sources, the calculator provides results that are both accurate and medically relevant.
After calculating, you’ll see a percentile number along with a brief explanation of what it means. This helps you understand whether your baby’s weight is within a typical range and how it compares to other babies the same age. However, it’s important to remember that the calculator is a guidance tool, not a diagnostic test.
Using a baby weight percentile calculator can give you peace of mind and help you track growth between doctor visits. It also allows you to notice patterns over time, making it easier to discuss your baby’s development with a pediatrician if questions or concerns arise.
How Baby Weight Percentiles Are Calculated
Baby weight percentiles are calculated using standardized growth charts developed from large-scale studies of healthy children. These charts show how babies typically grow over time and allow individual measurements to be compared against a reference population. The two most commonly used standards are the World Health Organization (WHO) growth charts and the Centers for Disease Control and Prevention (CDC) growth charts.
The calculation begins with three key factors: age, gender, and weight. Babies grow at different rates depending on their age, and boys and girls follow slightly different growth patterns. Because of this, weight measurements are always compared only with babies of the same age and gender. Even a difference of a few weeks in age can affect the percentile result, especially in younger infants.
Once the information is entered, the measurement is plotted on the appropriate growth chart. Statistical methods are then used to determine where the baby’s weight falls compared to the reference group. The result is expressed as a percentile, indicating the percentage of babies who weigh less than your child.
For example, if your baby’s weight falls on the 70th percentile curve, it means that 70% of babies of the same age and gender weigh less, while 30% weigh more. This doesn’t imply that one percentile is better than another—it simply describes position on the growth curve.
It’s also important to understand that growth charts are based on healthy population averages, not individual outcomes. Factors such as genetics, feeding methods, and birth weight influence where a baby lands on the chart. That’s why pediatricians focus on consistent growth patterns rather than isolated percentile readings when assessing a baby’s overall development.
Baby Weight Percentile Chart by Age and Gender
A baby weight percentile chart shows how a baby’s weight compares with others of the same age and gender. These charts are visual tools that display a range of percentile curves, allowing parents and healthcare providers to track growth over time rather than relying on a single measurement.
Weight percentile charts are always separated by gender because boys and girls grow differently, especially during infancy and early childhood. For this reason, a baby’s weight should only be compared with children of the same gender and similar age. Using the wrong chart can lead to confusing or misleading results.
Age is another critical factor when reading a weight percentile chart. For newborns and young infants, growth can change rapidly from week to week. As babies get older, weight gain typically slows down. The chart accounts for these changes by adjusting expected weight ranges for each age point, usually measured in weeks or months.
When reading the chart, you’ll see curved lines labeled with percentiles such as 5th, 10th, 25th, 50th, 75th, 90th, and 95th. Your baby’s weight is plotted on the chart, and the curve it aligns with indicates the percentile. For example, a baby whose weight follows the 25th percentile curve consistently is growing normally, even if they are smaller than average.
One common mistake parents make is focusing too much on where their baby falls compared to others. The real value of a percentile chart lies in tracking growth trends over time. A steady curve is usually a sign of healthy development, regardless of whether it’s higher or lower on the chart.
What Is a Normal Baby Weight Percentile?
Many parents wonder what a normal baby weight percentile is and whether their child should fall within a specific range. In general, pediatricians consider babies between the 5th and 85th percentiles to be within a typical, healthy range. However, “normal” does not mean identical, and healthy babies can naturally fall anywhere along the growth chart.
A baby’s percentile is influenced by several factors, including genetics, birth weight, feeding patterns, and overall health. For example, babies born to smaller parents often track lower percentiles, while babies with larger genetic frames may consistently track higher ones. Neither scenario automatically signals a problem if the baby is otherwise healthy and developing well.
What matters most is consistency. A baby who remains around the same percentile over time is usually growing appropriately, even if that percentile is on the lower or higher end of the chart. Pediatricians pay closer attention to sudden drops or jumps across multiple percentiles, as these changes may indicate feeding issues, illness, or other concerns that need further evaluation.
It’s also important to understand that percentiles are not targets to reach. A baby does not need to be in the 50th percentile to be healthy. The 50th percentile simply represents the midpoint of the population, not an ideal standard. Babies in the 10th or 75th percentile can be just as healthy as those in the middle.
Finally, weight percentiles should always be considered alongside other measurements such as length, head circumference, and developmental milestones. Looking at the whole picture helps ensure a more accurate and reassuring understanding of your baby’s growth.
What Different Baby Weight Percentiles Mean
Understanding what different baby weight percentiles mean can help parents interpret their child’s growth and avoid unnecessary worry. Percentiles show where your baby falls compared to others of the same age and gender, but they are not judgments of health or success.
- Below the 5th percentile: Babies in this range are smaller than most peers. This may be completely normal, especially for babies with smaller parents or those born slightly early. However, pediatricians may monitor growth more closely to ensure consistent weight gain.
- 10th–25th percentile: Babies in this range are smaller than average but often healthy. They may gain weight more slowly, yet as long as growth is steady, there’s usually no cause for concern.
- 50th percentile: The 50th percentile represents the median weight. Half of babies weigh less and half weigh more. Being here is average, but babies outside this percentile can still be perfectly healthy.
- 75th–90th percentile: These babies are larger than many peers. High percentiles may reflect genetics, feeding habits, or rapid growth. Consistent growth in this range is typically healthy.
- Above the 95th percentile: Babies in this range are heavier than most peers. Pediatricians may monitor for overfeeding, rapid weight gain, or medical conditions, but many babies are simply naturally larger.
Percentiles are best viewed as growth indicators, not grades. A single measurement is less important than patterns over time. Steady growth along a curve—regardless of whether it’s high, middle, or low—is usually a sign of healthy development. Understanding these percentiles helps parents make informed decisions and discuss growth confidently with pediatricians.
Baby Weight Percentile vs Growth Trend
While a single baby weight percentile can give you an idea of where your baby stands compared to peers, what really matters is the growth trend over time. Pediatricians focus on patterns because steady growth indicates healthy development, even if the percentile is low or high.
A baby may be in the 25th percentile at birth but gradually move up to the 40th percentile over several months. This upward trend can be reassuring, showing consistent weight gain. Similarly, a baby in the 75th percentile who stays in that range demonstrates stable growth, even if they are larger than most peers.
Sudden changes in percentile, however, can signal issues. For example, if a baby drops from the 50th percentile to the 10th percentile in a few months, pediatricians may investigate feeding difficulties, illness, or other health concerns. Conversely, rapid jumps to a higher percentile might indicate overfeeding or medical conditions that require monitoring.
It’s important for parents to track percentiles at regular intervals, ideally during routine pediatric visits, rather than obsessing over daily or weekly fluctuations. Weight naturally varies due to growth spurts, teething, illness, and changes in feeding.
Using a baby weight percentile calculator helps parents visualize these trends and compare multiple measurements over time. By focusing on patterns instead of a single number, parents can gain peace of mind, ensure their baby is on a healthy trajectory, and have meaningful discussions with pediatricians if adjustments are needed. Growth trends are the key to understanding your baby’s overall health, not isolated percentile numbers.
Newborn vs Infant vs Toddler Weight Percentiles
Baby weight percentiles vary significantly depending on age, and it’s important to understand the differences between newborns, infants, and toddlers. Each stage has its own growth patterns, which are reflected in percentile charts.
Newborns: In the first days after birth, babies often lose up to 10% of their birth weight, which is completely normal. By around two weeks, most babies regain this weight. Newborn percentiles can fluctuate slightly due to feeding adjustments, birth size, and gestational age. Percentiles at this stage help doctors ensure that babies are gaining weight steadily after the initial loss.
Infants (1–12 months): During infancy, growth is usually rapid but gradual. Babies may gain around 150–200 grams per week in the early months. Percentiles during this stage are particularly useful for tracking trends. A steady percentile, even if it’s lower or higher than average, indicates healthy growth. Sudden drops or jumps in percentiles may require closer attention from a pediatrician.
Toddlers (1–3 years): Growth slows down after the first year, and toddlers gain weight more slowly. Percentiles during this stage show long-term growth patterns rather than rapid changes. Toddlers may experience growth spurts or periods of slower weight gain, which is normal. Consistency along a percentile curve is more important than the specific percentile number.
By understanding the expected patterns for each age group, parents can better interpret their baby’s growth percentile. Tracking growth with a baby weight percentile calculator alongside regular pediatric checkups ensures that your child is developing steadily, giving peace of mind at every stage of early childhood.
Baby Weight Percentile and Feeding
A baby’s feeding habits play a major role in their weight percentile, but it’s important to remember that a healthy percentile can be achieved with different feeding approaches. Both breastfed and formula-fed babies can grow normally, even though their weight patterns may differ slightly.
Breastfed babies often gain weight more slowly after the first few months compared to formula-fed babies, which can result in slightly lower percentiles. This is completely normal and does not indicate poor health. Formula-fed babies may gain weight a bit faster, which can place them in higher percentiles, but as long as growth is consistent, this is also healthy.
When solid foods are introduced, usually around 6 months of age, weight gain patterns may change. Some babies may experience small jumps in percentiles, while others continue along their previous growth curve. Parents should monitor growth trends rather than focusing on single percentile numbers during this transition.
Overfeeding or undereating can affect a baby’s percentile, but most healthy babies self-regulate their intake. Pediatricians recommend following hunger and fullness cues rather than forcing extra milk or food.
Using a baby weight percentile calculator in combination with tracking feeding patterns can help parents see the relationship between nutrition and growth. Remember, a higher or lower percentile does not automatically indicate a problem. Consistent growth along a curve, balanced nutrition, and regular checkups are the keys to ensuring your baby’s healthy development. Understanding feeding patterns alongside weight percentiles provides a complete picture of your baby’s growth.
Common Myths About Baby Weight Percentiles
There are many misconceptions about baby weight percentiles that can cause unnecessary worry for parents. Understanding the facts can help you interpret growth data more accurately and stay calm.
Myth 1: Higher percentile means a healthier baby.
A baby in the 90th percentile isn’t automatically healthier than one in the 25th percentile. Percentiles simply show relative weight compared to peers. A consistently lower percentile can be perfectly normal, especially if it matches the baby’s family growth patterns.
Myth 2: Low percentile means failure to thrive.
A baby below the 10th percentile is not automatically unhealthy. Doctors look for growth trends over time rather than a single number. A baby who grows steadily along a lower percentile is usually healthy.
Myth 3: Percentiles predict adult size.
Percentiles only describe a baby’s current weight relative to peers. Genetics, nutrition, and lifestyle factors later in life determine adult height and weight. Percentiles are not forecasts.
Myth 4: One low reading signals a problem.
Weight can fluctuate due to illness, growth spurts, or measurement differences. Pediatricians assess multiple readings and overall trends before identifying any concern.
Myth 5: You must reach the 50th percentile.
There is no “ideal” percentile. What matters is consistent growth along a curve, not hitting a specific number.
By debunking these myths, parents can better understand their baby’s weight percentile and avoid unnecessary stress. Using a baby weight percentile calculator alongside regular pediatric checkups helps clarify trends, rather than focusing on a single number, allowing for informed and confident parenting.
When Should You Be Concerned?
While most babies grow normally within a wide range of percentiles, there are times when changes in weight may require closer attention. It’s important to know what signs to watch for without panicking over minor fluctuations.
Parents should be concerned if a baby shows a sudden drop in percentile, especially across two or more growth measurements. For example, a baby moving from the 50th percentile to below the 10th percentile in a short time may need evaluation. Sudden jumps to much higher percentiles can also indicate overfeeding or underlying health issues that require monitoring.
Other warning signs include inadequate weight gain over several weeks, persistent feeding difficulties, frequent vomiting, or signs of illness such as lethargy or dehydration. These may suggest that the baby is not getting sufficient nutrition or may have an underlying medical condition.
It’s important to remember that small fluctuations or temporary drops in percentile are usually normal. Growth can be influenced by factors like growth spurts, illness, teething, or changes in feeding routines. Pediatricians consider overall growth trends, not single measurements, when assessing a baby’s health.
If you notice consistent changes in growth percentiles or any concerning symptoms, it’s best to consult your pediatrician promptly. They can assess your baby’s feeding, development, and overall health, and provide guidance tailored to your child. Using a baby weight percentile calculator can help track growth trends and give you a clearer understanding of when professional advice may be needed.
How Often Should You Check Your Baby’s Weight Percentile?
Tracking your baby’s growth is important, but it’s equally important to do it at the right intervals. Checking too frequently can create unnecessary stress, while waiting too long may cause you to miss meaningful changes.
For most babies, weight is measured during routine pediatric checkups. In the first year, this typically happens monthly, and then every few months during toddlerhood. These checkups provide reliable measurements using calibrated scales, which are more accurate than home scales that can fluctuate.
Daily or weekly weighing at home is generally not recommended, as small fluctuations in weight are normal and can be misleading. Babies naturally lose or gain weight due to feeding patterns, digestion, illness, or growth spurts. Short-term changes don’t necessarily indicate a problem and should be interpreted with caution.
Using a baby weight percentile calculator between checkups can be helpful for tracking trends, but it should not replace professional guidance. Parents can enter accurate measurements taken at home or from the doctor’s office to see how their baby’s percentile changes over time. The goal is to observe consistent growth along a curve rather than focusing on a single number.
Regularly monitoring weight at appropriate intervals allows you to notice patterns, spot potential issues early, and have informed discussions with your pediatrician. Consistent tracking provides peace of mind and ensures your baby is developing steadily, while avoiding unnecessary worry over minor daily fluctuations.
WHO vs CDC Growth Charts – Which One Should You Use?
When tracking your baby’s weight percentile, you may encounter two widely used growth charts: the World Health Organization (WHO) charts and the Centers for Disease Control and Prevention (CDC) charts. Understanding the differences can help you interpret your baby’s growth more accurately.
The WHO growth charts are based on data collected from healthy, breastfed infants across multiple countries. They are considered the global standard for children under two years old and reflect optimal growth under ideal conditions. Pediatricians often use WHO charts for newborns and infants to monitor early growth and feeding patterns.
The CDC growth charts, on the other hand, are based on U.S. population data and are typically used for children over two years old. CDC charts include children fed both breastmilk and formula, making them more representative of the general U.S. population. They are often preferred when comparing children to typical national growth trends.
Both charts provide percentile curves, but the numbers may differ slightly due to variations in data and methodology. For instance, a baby at the 50th percentile on a WHO chart may fall slightly higher or lower on a CDC chart. This does not indicate a problem—it simply reflects differences in reference populations.
In practice, your pediatrician will recommend which chart to use based on your child’s age and feeding type. For parents using a baby weight percentile calculator, it’s important to select the correct chart to get accurate results. Understanding these differences ensures that you track your baby’s growth appropriately and interpret percentiles in a meaningful, reassuring way.
How Accurate Is a Baby Weight Percentile Calculator?
A baby weight percentile calculator is a helpful tool for parents, but it’s important to understand its limitations and accuracy. These calculators provide estimates based on established growth charts, such as those from the WHO or CDC, but they are not a substitute for a professional medical evaluation.
The accuracy of a calculator depends largely on the quality of the input data. Accurate weight measurements, correct age, and the proper selection of gender are essential. Even small errors, such as rounding weight incorrectly or using the wrong units (kg vs lbs), can slightly alter the percentile result.
Additionally, calculators typically provide a snapshot based on a single measurement. While useful, this does not reflect a baby’s overall growth trend. Pediatricians focus on consistent patterns over time rather than isolated numbers. A baby’s percentile may fluctuate slightly from week to week due to growth spurts, temporary illness, or changes in feeding, and these short-term changes are usually normal.
Another factor affecting accuracy is the choice of growth chart. WHO charts are designed for infants under two years, while CDC charts are more suitable for older children. Using the wrong chart can give results that appear higher or lower than expected, but this is a reflection of population differences rather than a health concern.
Ultimately, a baby weight percentile calculator is most accurate when used as a guidance tool alongside regular pediatric checkups. It helps parents track growth trends, understand percentile meaning, and identify potential concerns early—but it cannot replace professional medical advice or individualized assessment.
Frequently Asked Questions (FAQ)
Understanding baby weight percentiles can be confusing for many parents, so here are answers to the most common questions:
1. What percentile should my baby be in?
There is no single “ideal” percentile. Babies in the 5th–85th percentile are generally considered within a healthy range. Consistent growth over time is more important than a specific number.
2. Is 10th percentile baby weight normal?
Yes. A baby in the 10th percentile can be perfectly healthy, especially if they follow a steady growth curve. Percentiles alone do not indicate health problems.
3. Can percentiles change over time?
Absolutely. A baby’s percentile may move up or down due to growth spurts, feeding patterns, or developmental changes. Pediatricians focus on overall trends rather than single measurements.
4. Do percentiles differ by country?
Yes. WHO growth charts are based on international data and are used for infants under two, while CDC charts are based on U.S. population data and are generally used for older children. Slight differences between charts are normal.
5. Should I compare my baby to others?
No. Every baby grows at their own pace. Percentiles are tools to track individual growth, not competitions. Comparing can create unnecessary stress.
6. How often should I use a baby weight percentile calculator?
Use it occasionally to track trends, ideally after accurate weight measurements or pediatric visits. Avoid daily or weekly tracking to prevent unnecessary worry over normal fluctuations.
These FAQs help clarify common concerns and provide reassurance. Using a baby weight percentile calculator along with pediatric guidance ensures you understand your baby’s growth without misinterpreting the numbers.
Conclusion
Understanding your baby’s growth can feel overwhelming, especially when faced with terms like “percentiles” and “growth charts.”
A baby weight percentile calculator simplifies this process by providing a clear snapshot of where your baby falls compared to peers of the same age and gender.
It helps parents interpret numbers, track trends, and feel more confident about their child’s development.
It’s important to remember that percentiles are guidelines, not grades. Healthy babies can fall anywhere along the growth curve, and what matters most is consistent growth over time.
Sudden drops or spikes in percentile may require attention, but minor fluctuations are usually normal and reflect natural growth patterns, feeding variations, or developmental milestones.
Regular checkups with your pediatrician remain essential. They provide accurate measurements, interpret percentiles in context, and offer personalized advice based on your baby’s overall health.
Using a calculator in combination with these visits can give you reassurance, help you track trends between appointments, and make informed decisions about nutrition and development.
Finally, focus on your baby’s overall health and well-being rather than the numbers alone.
Percentiles, charts, and calculators are tools to guide you, but the love, care, and attention you give your baby are what truly support healthy growth.
With consistent monitoring, proper feeding, and regular pediatric guidance, you can ensure your baby is developing steadily and happily.
A baby weight percentile calculator is more than just a number—it’s a reassuring guide for parents who want to track growth confidently and stay informed about their child’s health.

I’m Mark Twain an American author best known for classics like The Adventures of Tom Sawyer and Huckleberry Finn. My timeless storytelling continues to inspire readers worldwide—discover more literary inspirations on CrushLinez.com.